- Research
- Open access
- Published:
Valuations using royalty data in the life sciences area—focused on anticancer and cardiovascular therapies
Journal of Open Innovation: Technology, Market, and Complexity volume 2, Article number: 1 (2016)
Abstract
Purpose
This research seeks to answer the basic question, “How can we build up the formula to estimate the proper royalty rate and up-front payment using the data I can get simply as input?” This paper suggests a way to estimate the proper royalty rate and up-front payment using a formula derived from the regression of historical royalty dataset.
Design/methodology/approach
This research analyzes the dataset, including the royalty-related data like running royalty rate (back-end payments) and up-front payment (up-front fee + milestones), regarding drug candidates for specific drug classes, like anticancer or cardiovascular, by regression analysis. Then, the formula to predict royalty-related data is derived using the attrition rate for the corresponding development phase of the drug candidate for the license deal and the revenue data of the license buyer (licensee). Lastly, the relationship between the formula to predict royalty-related data and the expected net present value is investigated.
Findings
For the anticancer (antineoplastics) and cardiovascular drug classes, the formula to predict the royalty rate and up-front payment is as follows.
In the case of Equations Equation 2 and Equation 4, it is statistically meaningful (R2: 039–0.41); however, in the case of Equations Equation 1 and Equation 3, it has a weak relationship (R2: 022–0.28), thus requiring further study.
Research limitations/implications (if applicable)
This research is limited to the relationship between two drug classes—anticancer (antineoplastics) and cardiovascular—and royalty-related data.
Practical implications (if applicable)
Valuation for the drug candidate within a specific drug class can be possible, and the royalty rate can be a variable according to drug class and licensee revenue.
Introduction
The existing valuation methodologies used in the life sciences area and their strengths and weaknesses
As shown in Fig. 1, the R & D process of medicine requires a lengthy long-term development period between 12 to 15 years and a development cost that can reach about USD 13 billion. However, among the number of drug candidates that ranges from 5000 to 10,000, only 1 can be finalized as the approved drug. Because of this, the attrition rate of medicine is extremely small. With this, the drug development process is categorized by the following development stages: drug discovery; preclinical testing; phase I, II, and III clinical trials; submission for approval; and phase IV. To sum up, drug development is expensive, time-consuming, complex, and risky.

R & D process of medicine (Richards 2003)
As shown in Tables 1 and 2, drug development requires a great amount of time and money for each development phase. In particular, the phase 3 clinical trial requires a huge amount, from 10 M$(Million dollar) to 60 M$(Million dollar), and about three years to complete. For this reason, the phase 3 clinical trial is regarded as the Death Valley that is necessary to overcome.
As shown in Fig. 2, the total number of pharmaceutical candidates in clinical development by the year 2005 exceeds more than 3000; here, the most number of candidates can be found in the phase 1 clinical trial while the least can be found in phase 3.

Clinical stage development candidates (Kessel and Frank 2007)
The prediction of the future value of the asset is useful and important to determine economical action (Lee and Lee 2015). Also, licensing deals between pharmaceutical companies and biotech/academia are popular in the life sciences area because drug development is expensive, time-consuming, complex, and risky.
As shown in Fig. 3, the total number of licensing deals for 1 year by the year 2006 reached almost 700 cases, and the total value of deals in the same year is lively enough to reach 77 B$(Billion dollar). Licensing deals, as you can see from the other paper, were increased from about 50 cases in 1993 to more than 400 cases in 2001—about an 8-fold increase as shown in Fig. 4.

Value of biotech out-licensing deals (Kessel and Frank 2007)

Total number of deals in the period 1992–2001 (Arnold et al. 2002)
In Fig. 5, the number of back-end payments (running royalties) is higher than that of up-front payments (up-front fee + milestones) in a normal license deal condition in all development stages.

Common deal terms by development stage (Source: Adapted Recombinant Capital) (Kessel and Frank 2007)
Determining a reasonable royalty rate for a licensing deal is highly difficult, and proper valuation is essential to make a reasonable determination. There are two major valuation approaches used in the life sciences area: discounted cash flow (DCF) and real options. According to a preceding paper (Puran 2005), the risk-adjusted net present value (rNPV), DCF, scenario analysis, and decision-tree method achieved the highest scores as the valuation methods used by biotech and pharma companies, analysts, and venture capital (VC) firms on value part-developed projects, as shown in Fig. 6. The DCF method is based on the knowledge that a dollar today will be worth less in the future; here, the most common DCF metric used in biotechnology is the net present value (NPV). The NPV evaluates situations by looking at investments in a product made today and comparing this with the future predicted stream of cash flow. That future value is then discounted back to its present value using a discount factor, which takes into account the time that it will take to realize product sales, the risk of getting the product into the market, and the “cost of money” invested (i.e., what the initial investment might be worth if invested elsewhere). The real options method evaluates investments and returns by increments. In this way, investments can be done slowly, giving enough time for one to learn more about the investment and defer the decision for further investments until uncertainty is reduced (Arnold et al. 2002). The valuation methodology for new drug pipelines includes rNPV or eNPV (expected NPV) or the probability-adjusted NPV method in which technical risk is reflected on the cash flow, the scenario-implemented decision tree method, which calculates the weighted average NPV according to the probability of specific scenarios, and real options, which is often used by financial professionals but are not preferred by drug experts. The rNPV method is most frequently used in practical work in the life sciences area (Lee 2010).

Valuation methods used by biotech, pharma companies, analysts, and VC firms (Puran 2005)
Figure 7 shows a screenshot of the Excel application to apply the rNPV methodology developed by Dr. Jeffrey J. Stewart of the Milken Institute.

Excel application to apply the rNPV methodology developed by Dr. Jeffrey J. Stewart of the Milken Institute (Stewart et al. 2001)

Figure 8 shows an example of the application of the decision alternative and tree methodology on the valuation for a licensing deal by Merck & Co.

An example of the application of the decision alternative and tree methodology (Cho 2004)
Table 3 shows the pros and cons of the two main valuation methodologies: DCF and real options. While DCF has been the gold standard for years, real options valuation is gaining grounds and is regarded as a possible alternative in life sciences. Both methods have their advantages and drawbacks. DCF, when applied to early stage projects, generally yields negative values; nevertheless, the industry remains profitable. Consequently, managers do not trust their valuations and disregard the recommendation retrieved from the valuations. Projects in early development are continued despite their negative DCF values. This often translates into a general refusal of quantitative methods. As soon as it comes to licensing and M&A, companies are in urgent need of a valuation method that displays the correct value of early stage projects. Real options valuation, on the other hand, has been developed to overcome the shortfalls of DCF; however, it is still regarded as too complex and highly theoretic, compared to the easy-to-use DCF method. Today, there is no standard on how to apply the method to life sciences valuation.
Table 4 shows the main pros and cons of the four methods of the real options valuation methodology. All four methods of the real options methodology yield the same result, but the ways to achieve it are different. In case of the formula and finite difference methods, the calculation process is similar to a black box, as it is not visible, and here, it is not helpful to use a formula. In case of the simulations method, it gives a good impression about the uncertainty of the value and is, therefore, an excellent risk measurement too1. However, the process of the simulations method is time-consuming and carries a path-dependency problem. In case of the trees method, it is easy to understand and visualize what can happen to the market, but the link to the value drivers continues to be missing.
Review of preceding research
The prevailing wisdom in the biotech industry is that the main factor driving the size of a deal is the development phase—whether preclinical, clinical, or approval. Because of this, the attrition rate of each development phase is used in the eNPV valuation in the life sciences area. Table 5 shows an example of the process to derive the risk-adjusted added-value pharmaceutical NPV from the attrition rate (Blair 2008). The eNPV (rNPV) value can be derived by multiplying the attrition rate of each development phase of the drug to the NPV in the table.
The valuation is required to proceed the licensing agreement, and the latest attrition rate mainly used for the valuation in the life sciences area is that of Dr. Joseph A. DiMasi, as shown in Table 6 (DiMasi et al. 2010).
There is a preceding research work on the main factor driving the size of the licensing deal in the life sciences area that fully evaluated 105 biotechnology drug deals signed over the past 10 years, identifying the factors that influenced the size of the deal in a statistically significant manner and then comparing these results with the opinions of a panel of industry leaders actively involved in the out-licensing of products and technologies (Arnold et al. 2002). According to the paper, there are 6 factors that influence the value of a licensing deal, and the ranking of factors from the manager panel of 16 biotechnology leaders is available, as shown in Table 7. Here, the ranking of the factors for influencing the deal size follows this order: development phase, drug class, contract type, contract scope, licensee, and molecular structure. These factors can be the candidates for the input to estimate the size of a licensing deal in the life sciences area. In the same paper, other value drivers, like the market, strategies, competition, intellectual property (IP), novelty, and so on, can also be found, as shown in Table 8. This study considers the likely candidates for the input to estimate the size of a licensing deal in the life sciences area as the development phase, drug class, market size, IP, and molecular structure, taking data availability and the ease of quantification into consideration.
As a likely candidate for the input to estimate the size of a licensing deal in the life sciences area, there is a drug classification of over 300 kinds according to Drugs.com, which is the largest, most widely visited, independent medicine information Web site available on the Internet (Drugs.com 2015). However, such a detailed drug classification is not available in the licensing deal data; thus, a simpler drug classification like that in Table 9 is needed for this study. Table 9 shows the main drug classification by Drugs.com, and there are 21 main drug classes.
There is only one case to perform the regression analysis on the work on evaluating pharmaceutical licensing agreements (Arnold et al. 2002; Rogers and Maranas 2005), but the analysis for historical licensing data was for identifying the factors that most affect a deal’s financial terms (Arnold et al. 2002; Rogers and Maranas 2005). In reviewing the preceding research, there have been no cases where a regression analysis could be performed to estimate the proper royalty rate and up-front payment using the formula derived from the regression of the dataset of historical licensing data.
This study is believed to be the first case to estimate the royalty rate and up-front payment using the formula derived from the regression of the dataset of historical licensing data, and can therefore be used as a simple tool to answer the basic question, “How can we find the formula to estimate the proper royalty rate and up-front payment using the data I can get simply as input?” It can also be a good starting point to be referred to by a manager in case of negotiations in pharmaceutical licensing deals for a specific drug class.
Research design and scope and limitation
Research design
The purpose of this research is to derive the formula to predict royalty-related data, such as running royalty rate (back-end payments) and up-front payment (up-front fee + milestones), using the attrition rate for the corresponding development phase of the drug candidate within a specific drug class, such as anticancer (antineoplastics) or cardiovascular, and the revenue data of the license buyer (licensee) using regression analysis. Another purpose is to find the relationship between the formula to predict royalty-related data and eNPV.
According to the preceding research, the main factors to drive the size of licensing deals in the life sciences area are development phase, drug class, contract type, contract scope, licensee, molecular structure, market, strategies, competition, IP, and novelty (Arnold et al. 2002). Market size, licensee revenue, molecular structure, and IP can be converted to numerical value and can be used for the input for prediction for royalty-related data such as running royalty rate (back-end payments) and up-front payment (up-front fee + milestones). In the case of market size, it requires a great amount of time to estimate the proper market size for the subclass of a drug class (e.g., epidermal growth factor, anticancer immunity, ovarian cancer, alpha interferon as a subclass of the anticancer drug class). In the case of molecular structure, it requires professional chemical software to convert chemical structure into numeric code and requires the collection of molecular structure information for the drug candidate. In the case of IP, identifying what could be the unique descriptor for the drug-related patents for input for the X-axis of regression requires more thought (e.g., the technology cycle time median value for the International Patent Classification (IPC) code can be the descriptor candidate). This study selected drug class, licensee revenue, and attrition rate for the development phase as descriptors for the input for the X-axis of regression.
The main research procedure is divided into three steps as shown in Fig. 9: data collection, data normalization, and regression analysis.

Procedure and steps to carry out research
-
Step 1. Collection of data such as the running royalty rate, up-front fee, milestones, licensor, licensee, the revenue of licensee, the corresponding drug class, and the development phase in drug licensing deals
This study collected the data for two drug classes in the format of Table 10: anticancer and cardiovascular. Data collection is based on the following resources: ① Book: Royalty Rates for Pharmaceuticals and Biotechnology, 8th Edition Published by IPRA Inc (2012); ② Book: Intellectual Property: Valuation, Exploitation, and Infringement Damages, written by Russell L. Parr and Smith (2005); ③ Site for checking the deal condition: http://www.sec.gov/ (U.S. Securities and Exchange Commission); ④ Site for checking the development phase: https://clinicaltrials.gov; ⑤ Site for checking the revenue of Licensee: http://www.google.com/finance and http://finance.yahoo.com/; ⑥ Site to retrieve the needed data: http://www.google.com.
Table 10 Example of data collection (IPRA Inc 2012) -
Step 2. Preparation of dataset ready for regression analysis via data normalization like in Figs. 10 and 11
Fig. 10 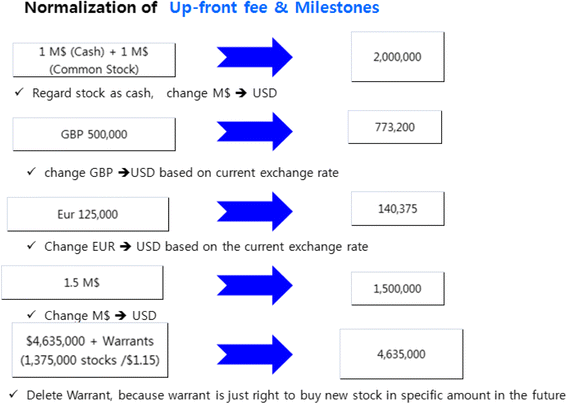
Normalization example of up-front payment (up-front fee + milestones)
Fig. 11 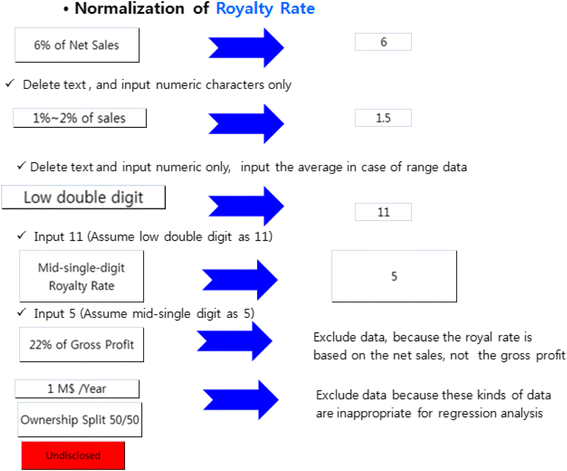
Normalization example of back-end payment (running royalty rate)
-
Step 3. Regression analysis to investigate the relationship between (attrition rate * licensee revenue) and up-front payment (up-front fee + milestones) and the relationship between attrition rate * licensee revenue and back-end payment (running royalty rate)
Used software: ① Preliminary analysis for checking rough type: Microsoft Office Excel 2007
② Main analysis: open-source statistical software
-
Regression 1: X-axis = (attrition rate * licensee revenue)/100
Y-axis = up-front payment (up-front fee + milestones) [Unit: USD]
-
Regression 2: X-axis = (attrition rate * licensee revenue)/100
Y-axis = back-end payment (running royalty rate) [Unit: USD]
-


Scope and limitation of research
The scope of this research is to derive the formula to predict royalty-related data, such as running royalty rate (back-end payments) and up-front payment (up-front fee + milestones), using the attrition rate for the corresponding development phase of the drug candidate for the anticancer (antineoplastics) or cardiovascular drug class and the revenue data of the license buyer (licensee), and to investigate the relationship between the formula to predict royalty-related data and eNPV. Statistically speaking, this research derives the formula to predict royalty-related data using a single independent variable like royalty rate and up-front payment, (attrition rate * licensee revenue)/100]. Also, this research selected drug class, licensee revenue, and attrition rate for the development phase as descriptors for the input for the X-axis of regression. This study is limited to the relationship between the two drug classes of anticancer (antineoplastics) and cardiovascular and royalty-related data. For further studies, it is advised that the relationship be analyzed in more detail to involve more drug classes and royalty-related data using several independent variables through software like SPSS or SAS.
Analysis of dataset
Analysis of anticancer (Antineoplastics) dataset
As shown in Table 11 and Fig. 12, the number of the phase II-related stage deals (phase I/II, phase II, phase II/III) is dominant (over 43 %) in the anticancer (antineoplastics) dataset collected.

Distribution of the development phase in the anticancer (antineoplastics) dataset
The average of the up-front fees in the anticancer (antineoplastics) dataset collected is USD 6,123,474, and the average of the milestones in the anticancer dataset is USD 30,088,181. With this, the average royalty rate in the anticancer dataset is 8 % and is slightly higher than average royalty in pharma/biotech license deals in Table 13 and lower than the average royalty rate (11.5 %) of phase II in Table 14.
Tables 12, 13, 14, and 15 show several industry guidelines for royalty rates published by several groups.
Analysis of cardiovascular dataset
As shown in Table 16 and Fig. 13, the number of the phase III stage deals and NDA/BLA stage deals is dominant (over 61 %) in the cardiovascular dataset collected.

Distribution of the development phase in the cardiovascular dataset
The average of the up-front fees in the cardiovascular dataset collected is USD 10,886,596, and the average of the milestones in the anticancer dataset is USD 10,167,742. The average royalty rate in the anticancer dataset is 10 % and is slightly higher than the average royalty in pharma/biotech license deals in Table 13 and slightly lower than the average royalty rate (15 %) of Phase III; it is much lower than the average royalty rate (20 %+) of launched products in Table 16.
Regression analysis
Preliminary regression analysis of anticancer (Antineoplastics) dataset
To detect and exclude outliers (an observation point that is distant from other observations in statistics) and to find proper regression models for a specific dataset, a preliminary regression analysis using Microsoft Excel is needed. Figures 18 and 19 show some outliers, and a linear regression model does not fit the anticancer dataset.
The following items are the X-axis and Y-axis input information in the regression analysis in Figs. 14 and 15.
-
Figure 14: X-axis = (attrition rate * licensee revenue)/100
Fig. 14 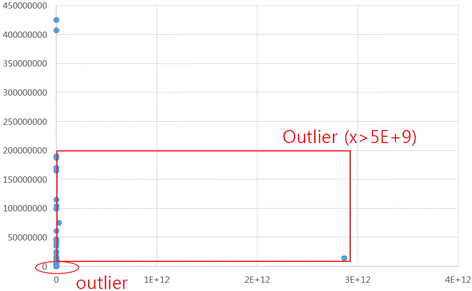
Preliminary regression analysis of the anticancer (antineoplastics) dataset for up-front payment (up-front fee + milestones)
Fig. 15 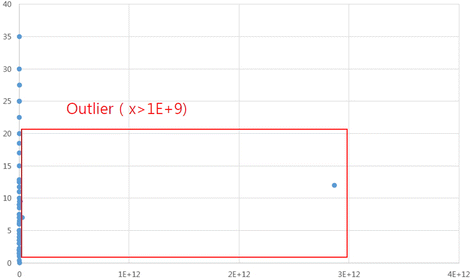
Preliminary regression analysis of the anticancer (antineoplastics) dataset for royalty rates
Y-axis = up-front payment (up-front fee + milestones) [Unit: USD]
-
Figure 15: X-axis = (attrition rate * licensee revenue)/100
Y-axis = back-end payment (running royalty rate) [Unit: USD]


The deal data from the preliminary regression was excluded if the normalization of the “royalty rate” data is not possible (a total six sets of deal data).
This study selected outliers in the following cases according to the result from the preliminary regression analysis of the anticancer (antineoplastics) dataset; such outliers from the main regression analysis in section Main regression analysis of anticancer dataset by open-source statistical software were excluded.
-
① If “up-front payment” has a value of 0 (zero), it is selected as an outlier (a total of 15 outliers).
-
② If “(attrition rate * licensee revenue)/100” has a value of more than 5,000,000,000, it is selected as an outlier (a total of 3 outliers),
Thus, the number of deal data used for the main regression analysis to develop the model for prediction is 48.
The deal data from the preliminary regression was excluded if the normalization of the “royalty rate” data is not possible (a total of seven sets of deal data).
Outliers were selected in the following cases according to the result from the preliminary regression analysis of the anticancer (antineoplastics) dataset, and such outliers from the main regression analysis in section Main regression analysis of anticancer dataset by open-source statistical software were excluded.
-
① If “(attrition rate * licensee revenue)/100” has a value of more than 1,000,000,000, it is selected as an outlier (a total of eight outliers).
Thus, the number of deal data used for the main regression analysis to develop the model for prediction is 57.
Main regression analysis of anticancer dataset by open-source statistical software
The used regression model for investigating the relationship between (attrition rate * licensee revenue)/100 and up-front payment (up-front fee + milestones) is “Rational Model, 3 Parameter Type 4 Regression”, having the following formula type and curve type in a statistical software; its graph is as shown in Fig. 16, and its prediction formula follows Equation 1.

Main regression analysis of the anticancer dataset by statistical software for up-front payment (up-front fee + milestones): X-axis (real up-front payment) vs. Y-axis (predicted up-front payment)
[Curve type]

Equation 1
R2 = 0.384618
X = (attrition rate * licensee revenue)/100
Y = up-front payment (up-front fee + milestones) [Unit: USD]
The used regression model for investigating the relationship between (attrition rate * licensee revenue)/100 and royalty rates is “Rational Model, 3 Parameter Type 2 Regression” having the following formula type and curve type in a statistical software; its graph is as shown in Fig. 17, and its prediction formula follows Equation 2.

Main regression analysis of the anticancer dataset by statistical software for royalty rates: X-axis (real royalty rate) vs. Y-axis (predicted royalty rate)
[Curve type]

Equation 2
R2 = 0.223928
X = (attrition rate * licensee revenue)/100
Y = royalty rates [Unit: %]
Preliminary regression analysis of cardiovascular dataset
To detect and exclude outliers (an observation point that is distant from other observations in statistics) and to find proper regression models for a specific dataset, a preliminary analysis using Microsoft Excel is needed. Figures 22 and 23 show some outliers, and a linear regression model does not fit the cardiovascular dataset.
The following items are the X-axis and Y-axis input information in the analysis in Figs. 18 and 19.
-
Figure 18: X-axis = (attrition rate * licensee revenue)/100
Fig. 18 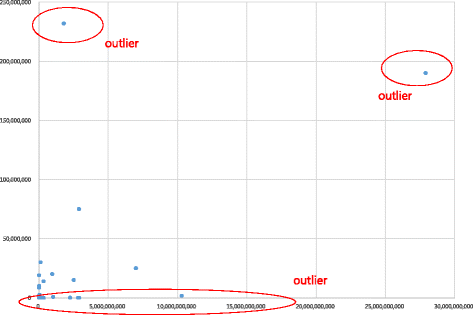
Preliminary regression analysis of the cardiovascular dataset for up-front payment (up-front fee + milestones)
Fig. 19 
Preliminary regression analysis of the cardiovascular dataset for royalty rates
Y-axis = up-front payment (up-front fee + milestones) [Unit: USD]
-
Figure 19: X-axis = (attrition rate * licensee revenue)/100
Y-axis = back-end payment (running royalty rate) [Unit: USD]


The deal data from the preliminary regression was excluded if the normalization of the “royalty rate” data is not possible (a total of one set of deal data).
Outliers were selected in the following cases according to the result from the preliminary regression analysis of the cardiovascular dataset, and such outliers from the main regression analysis in section Main regression analysis of cardiovascular dataset by open-source statistical software were excluded.
-
① If the “up-front payment” has a value under 50,000, it is selected as an outlier (a total of 12 outliers).
-
② If the “up-front payment” has a value of more than 190,000,000, it is selected as an outlier (a total of 2 outliers).
Thus, the number of deal data used for the main regression analysis to develop the model for prediction is 16.
The deal data from the preliminary regression was excluded if the normalization of the “royalty rate” data is not possible (a total of one set of deal data).
Outliers were selected in the following cases according to the result from the preliminary regression analysis of the cardiovascular dataset, and such outliers from the main regression analysis in section Main regression analysis of cardiovascular dataset by open-source statistical software were excluded.
-
① If the “royalty rate” has a value of more than 25, it is selected as an outlier (a total of 3 outliers).
Thus, the number of deal data used for the main regression analysis to develop the model for prediction is 27.
Main regression analysis of cardiovascular dataset by open-source statistical software
The used regression model for investigating the relationship between (attrition rate * licensee revenue)/100 and up-front payment (up-front fee + milestones) is the “Polynomial Model, Quadratic-type Regression” having the following formula type and curve type in a statistical software; its graph is as shown in Fig. 20, and its prediction formula follows Equation 3.

Main regression analysis of the cardiovascular dataset by statistical software for up-front payment (up-front fee + milestones): X-axis (real up-front payment) vs. Y-axis (predicted up-front payment)
[Curve type]

Equation 3
R2 = 0.413879
X = (attrition rate * licensee revenue)/100
Y = up-front payment (up-front fee + milestones) [Unit: USD]
The used regression model for investigating the relationship between (attrition rate * licensee revenue)/100 and royalty rates is “Polynomial Model, Inverse Second Order-type Regression” having the following formula type and curve type in a statistical software; its graph is as shown in Fig. 21, and its prediction formula follows Equation 4.

Main regression analysis of the cardiovascular dataset by statistical software for royalty rates: X-axis (real royalty rate) vs. Y-axis (predicted royalty rate)
[Curve type]

Equation 4
R2 = 0.287886
X = (attrition rate * licensee revenue)/100
Y = royalty rates [Unit: %]
Discussion
A regression analysis was carried out to estimate up-front payments and royalty rates for two datasets of anticancer (antineoplastics) and cardiovascular drug classes. In the case of the prediction of up-front payments, the models for predicting having an R2 value of 0.384618 for the anticancer (antineoplastics) dataset and an R2 value of 0.413879 for the cardiovascular dataset were obtained through statistical analyses. In case of the prediction of royalty rates, the models for predicting having an R2 value of 0.223928 for the anticancer (antineoplastics) dataset and an R2 value of 0.287886 for the cardiovascular dataset were obtained through statistical analyses. Figure 22 shows the overview of the process of this study.

Overview of the study’s process
This study was presented with many limitations to reasonably determine the variables for prediction because up-front payments and royalty rates are determined by various environmental variables in the field. However, this study developed a prediction model having an R2 value of about 0.4 if the variables of “attrition rate * licensee revenue” are used. This is a “statistically significant” finding, and it shows the importance of the variables of “attrition rate * licensee revenue” for determining up-front payments. Thus, the said variables can be used as the solid basis for evaluating up-front payments in the future.
In the case of the prediction of royalty rates, this study achieved a low R2 value of about 0.25 in the statistical analysis using the variables of “attrition rate * licensee revenue”. This means that it is not possible to perform the analysis reasonably using the said variables only. Because of this, the introduction of other variables is necessary for the analysis of royalty rates.
It is possible to identify the relationship between the eNPV and input for the regression formula as shown in Fig. 23. This can be used for predicting rough eNPV using the licensee’s revenue and the licensee’s maximum reserve for the project according to the development phase and drug class.

The relationship between the eNPV and input for the regression formula
Conclusion
Summary
This study yielded meaningful results as it aimed to create a tool to predict royalty rate and up-front payment (up-front fee + milestones) only using knowledge on the development phase and its attrition rate, drug class, and licensee’s revenue, which can easily be known.
It is possible to predict rough eNPV using the licensee’s revenue and the licensee’s maximum reserve for the project according to the development phase instead of the attrition rate for the development phase.
Implications
This study allowed valuation of a drug specific to a drug class and proved that the royalty rate can be a variable according to drug class and licensee.
Topics for further research
Further in-depth research is necessary for the following topics in the future.
-
① The relationship to involve more drug classes and royalty-related data.
-
② Regression analysis using several independent variables through software such as SPSS or SAS.
-
③ Regression analysis to investigate the relationship between royalty-related data and more input descriptors such as market size, molecular structure (numerical code for substructure/fragment), and IP (technology cycle time median value for the IPC code).
References
Arnold K, Coia A, Saywell S, Smith T, Minick S, Löffler A. Value drivers in licensing deals. Nat Biotechnol. 2002;20:1085–9.
Blair ED. Assessing the value-adding impact of diagnostic-type tests on drug development and marketing. Mol Diagn Ther. 2008;12(5):331–7.
Bogdan B, Villiger R. Valuation in life sciences—a practical guide. 3rd ed. New York: Springer; 2010.
Cho BS. Biotech business case study—Merck & Co.: evaluating a drug licensing opportunity. BioWave. 2004 6(21):1–12.
DiMasi JA, Feldman L, Seckler A, Wilson A. Trends in risks associated with new drug development: success rates for investigational drugs. Clin Pharmacol Ther. 2010;87(3):272–7.
Drugs.com. Drug classes. 2015. http://www.drugs.com/drug-classes.html.
IPRA Inc. Royalty rates for pharmaceuticals & biotechnology, 8th Edition. 2012.
Kessel M, Frank F. A better prescription for drug-development financing. Nat Biotechnol. 2007a;25(8):859–66.
Lee SJ. Valuation in life sciences and portfolio management. 2008 Korean Crystal Ball User Conference. 2010.
Lee S, Lee K. Heterogeneous expectations leading to bubbles and crashes in asset markets: Tipping point, herding behavior and group effect in an agent-based model. J Open Innov. 2015;2015:1–12.
Parr RL, Smith GV. Valuation, Exploitation, and Infringement Damages. 2005.
Puran S. The valuation of part-developed projects in the pharmaceutical sector. Masters of BioScience Enterprise, Fitzwilliam College, sponsored by Cambridge Healthcare and Biotech. 2005.
Richards D. Drug development and regulation. Medicine. 2003;31(8):25–31.
Rogers MJ, Maranas CD. Valuation and design of pharmaceutical R&D licensing deals. AIChE J. 2005;51(1):198–209.
Stewart JJ, Allison PN, Johnson RS. Putting a price on biotechnology. Nat Biotechnol. 2001;19(9):813–7.
Acknowledgments
We would like to show our gratitude to Dr. Kee Heon Cho of Korea Valuation Association and Dr. Sung-Joo Lee of Sanofi-aventis Korea for their guidance, and to KISTI for the data source provided.
Author information
Authors and Affiliations
Corresponding author
Rights and permissions
Open Access This article is distributed under the terms of the Creative Commons Attribution 4.0 International License (http://creativecommons.org/licenses/by/4.0/), which permits unrestricted use, distribution, and reproduction in any medium, provided you give appropriate credit to the original author(s) and the source, provide a link to the Creative Commons license, and indicate if changes were made.
About this article

Cite this article
Lee, J.H., In, Y., Lee, IH. et al. Valuations using royalty data in the life sciences area—focused on anticancer and cardiovascular therapies. J. open innov. 2, 1 (2016). https://doi.org/10.1186/s40852-015-0025-5
Received:
Accepted:
Published:
DOI: https://doi.org/10.1186/s40852-015-0025-5